Exit waterfall · cap table · deal reality

From headline price to cash in hand.

Ownership is not proceeds. Waterfall IQ shows who actually gets paid when a company is sold: after preferences, SAFEs, debt, escrow and earnouts. In plain words, to the cent.

No sign-up to explore the sample company. No card, ever, to start.

Exact to the centExplains every numberYour inputs stay yours
Try it: one investor, one founder$30M sale
$0$75M$150M
Series A investor
Founders

One tool, four questions

See who gets paid, in order.

Open it and try

Waterfall IQ
Exit waterfall screenCap table and structure screenBreakpoints screenHeadline to cash screen
To the cent
Every payout calculated in exact decimal arithmetic, and the classes always add up to the equity value
600+
automated tests, including thousands of randomly built cap tables
8 views
from the cap table to breakpoints, offers and a printable report
0 formulas
to audit or break: every figure is explained step by step

Why it matters

The price is only the start of the story.

Public research on what happens around a sale, and why the numbers deserve a second look.

~3 in 10
private M&A deals see an indemnification claim after closing, so escrow is not a formality.

Source: SRS Acquiom, M&A Earnouts & Claims Study, 2026

15 months
median time to resolve a fully litigated or arbitrated claim, while money sits in escrow.

Source: SRS Acquiom, 2026 study

6% → 14%
Series A companies' share of startup shutdowns, 2024 to 2025: more exits happen after real money was raised, where preferences decide who is paid.

Source: SimpleClosure, State of Startup Shutdowns 2025

Figures are from the cited public sources as read in October 2026 and will be refreshed before launch.

Who gets paid

The same sale looks different from every seat.

Pick a role and see what Waterfall IQ shows you.

What will I really take home?

A 10% stake is not 10% of the price. Preferences, SAFEs and debt come first. See your proceeds at any exit price, the price at which common stock starts to be paid, and what a better term sheet is worth in money.

Why ownership is not proceeds →

  • Your proceeds and your share of each extra million
  • The exit value where you first receive money
  • What each term costs you, in dollars

What is my position worth, and when?

See cost, proceeds and multiple for a fund or a single holder, the exit values at which you reach money back, 2x and 3x, and how an earnout or escrow changes the answer.

From headline price to cash →

  • Money back, 2x and 3x exit values
  • Cash on the day, expected cash and present value
  • Compare two offers class by class

Are my options worth anything?

Options are paid net of their strike and only above the preferences. See the value per share, whether your strike is in the money, and how the answer moves as the price changes.

How a waterfall works →

  • Value per common share at your exit
  • The point where options come into the money
  • A plain-language explanation of every step

Is this allocation right?

Paste the numbers someone else produced. Waterfall IQ recalculates from the terms, shows where they differ, and lists the most likely reasons, such as a class treated as participating when it is not.

How to check a waterfall →

  • Class-by-class comparison with a clear verdict
  • Ranked likely causes of any gap
  • A printable reconciliation to send back

Why spreadsheets fall short

Four things that go wrong on every exit.

%

Ownership is not proceeds

Twenty percent can be 83% of a small sale and 20% of a large one. Preferences move the money.

$

The headline is not the cash

Escrow, holdbacks and earnouts arrive later, or not at all. Cash on the day is often well under the headline.

⚠

Spreadsheets break silently

Circular references and hidden rows give a plausible number that is wrong. Here every figure is reconciled and explained.

⇆

Other people's numbers

When someone hands you an allocation, you need to know if it is right, and if not, why. Fast, and without a legal review.

Follow the money

Watch $100M of sale price run downhill.

Scroll. The bar on the left shows where every dollar of a sale goes, one step at a time.

The headline price

$100M
Step 1

A company sells for $100M.

That is the headline: the price for the whole business. It is the number in the press release, and almost nobody receives it.

Step 2

Debt and costs come off first.

The bank is repaid and the advisers are paid. What is left, the equity value, is the amount shared among shareholders.

Step 3

Then the preferred investors, in order.

Investors who negotiated a liquidation preference are paid before common stock, by rank. Here that is $45M gone before the founders see a dollar.

Step 4

What is left is shared.

Founders, employees with options and early angels share the remainder. Add up your percentage of the company and you will not get this number. That is the whole point.
Do this with your own cap table

Test your instinct

How much does the investor receive?

Series A invested $10M for 20% of a company, with a 1x participating preference. The company sells for $40M. How much does Series A receive?

Series A takes its $10M preference first, leaving $30M. Because it participates, it also takes 20% of that $30M, which is $6M. Total: $16M, or 40% of the sale from a 20% stake. Founders receive $24M.

Read how participation works ·

How it works

From cap table to report you can send in five steps.

Live recalculation, every change
01

Enter the structure

Add each class: shares, price, rank and terms. Standard terms are filled in and the coach explains every field. Or import from Excel.

02

Pick an exit

Drag the enterprise value. Debt and costs come off to reach the equity value that is shared out.

03

See who gets paid

Charts and plain sentences for every class: took its preference, converted, participated, or received nothing.

04

Test the deal

Compare exits, find the breakpoints, model escrow and earnouts, and check another party's numbers.

05

Share the result

Print a detailed report, export to Excel with charts, and keep named versions with notes on what changed.

Every number is explained

Tap any class and see the working in words:

Series H. Takes its $54.7M preference first, then also shares in what is left (it participates): $8.71M more, $63.5M in all.
Series I. Gives up its $30.0M preference because as ordinary shares it is worth $63.4M, which is more.
Options B. Out of the money: the shares are worth less than the strike, so it is not exercised.

Open the sample

See it

The tool, as it looks.

Real screens from the sample company. Open the tool to try them yourself.

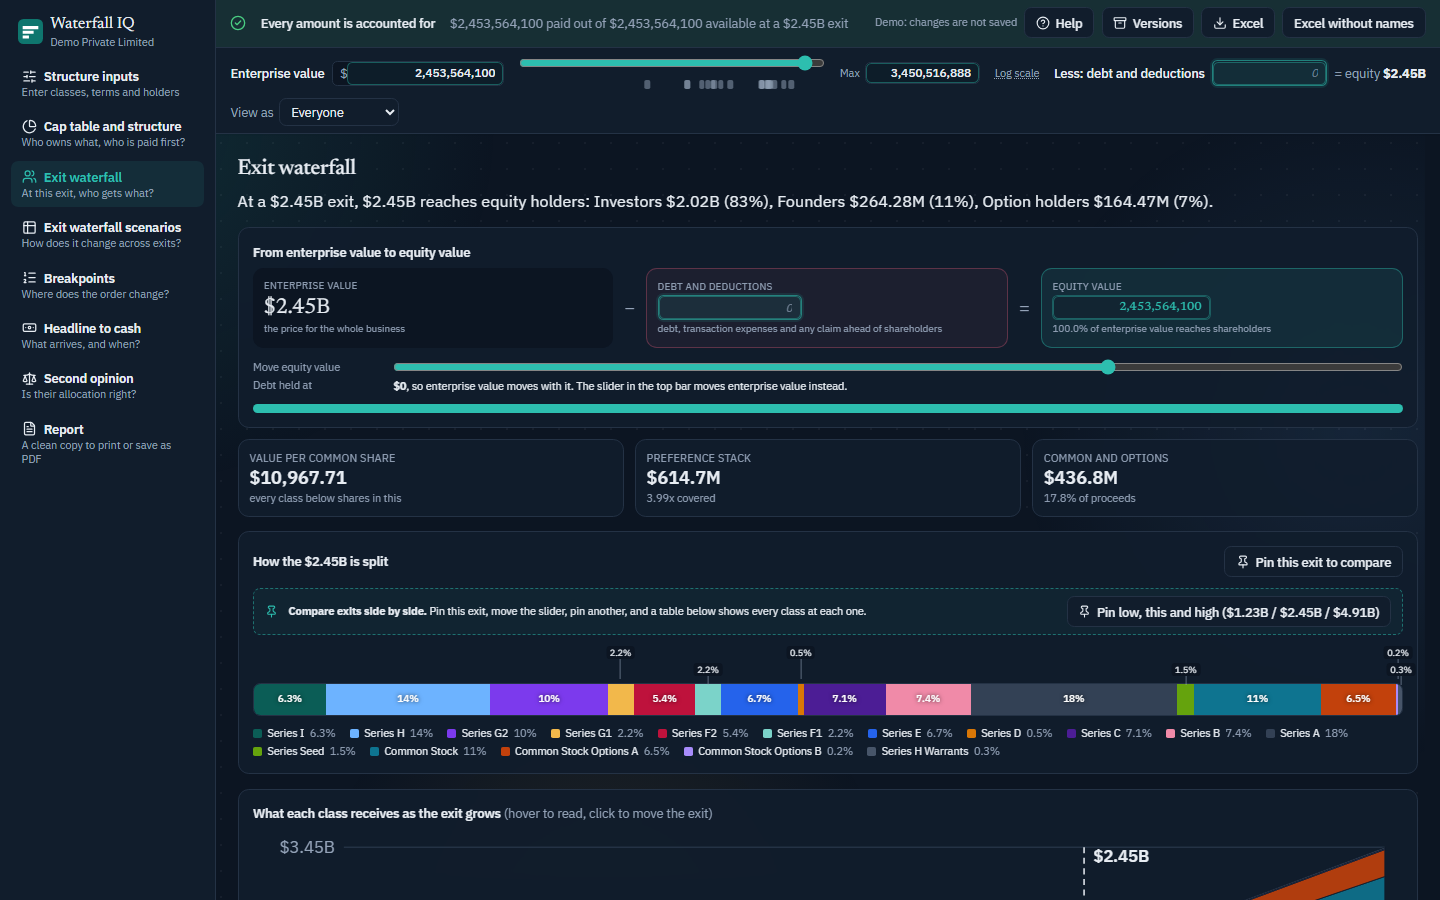
Waterfall IQ · Exit waterfall
Waterfall IQ Exit waterfall screen: Enterprise value to equity value, then who receives what, with a sentence for every class.

Enterprise value to equity value, then who receives what, with a sentence for every class.

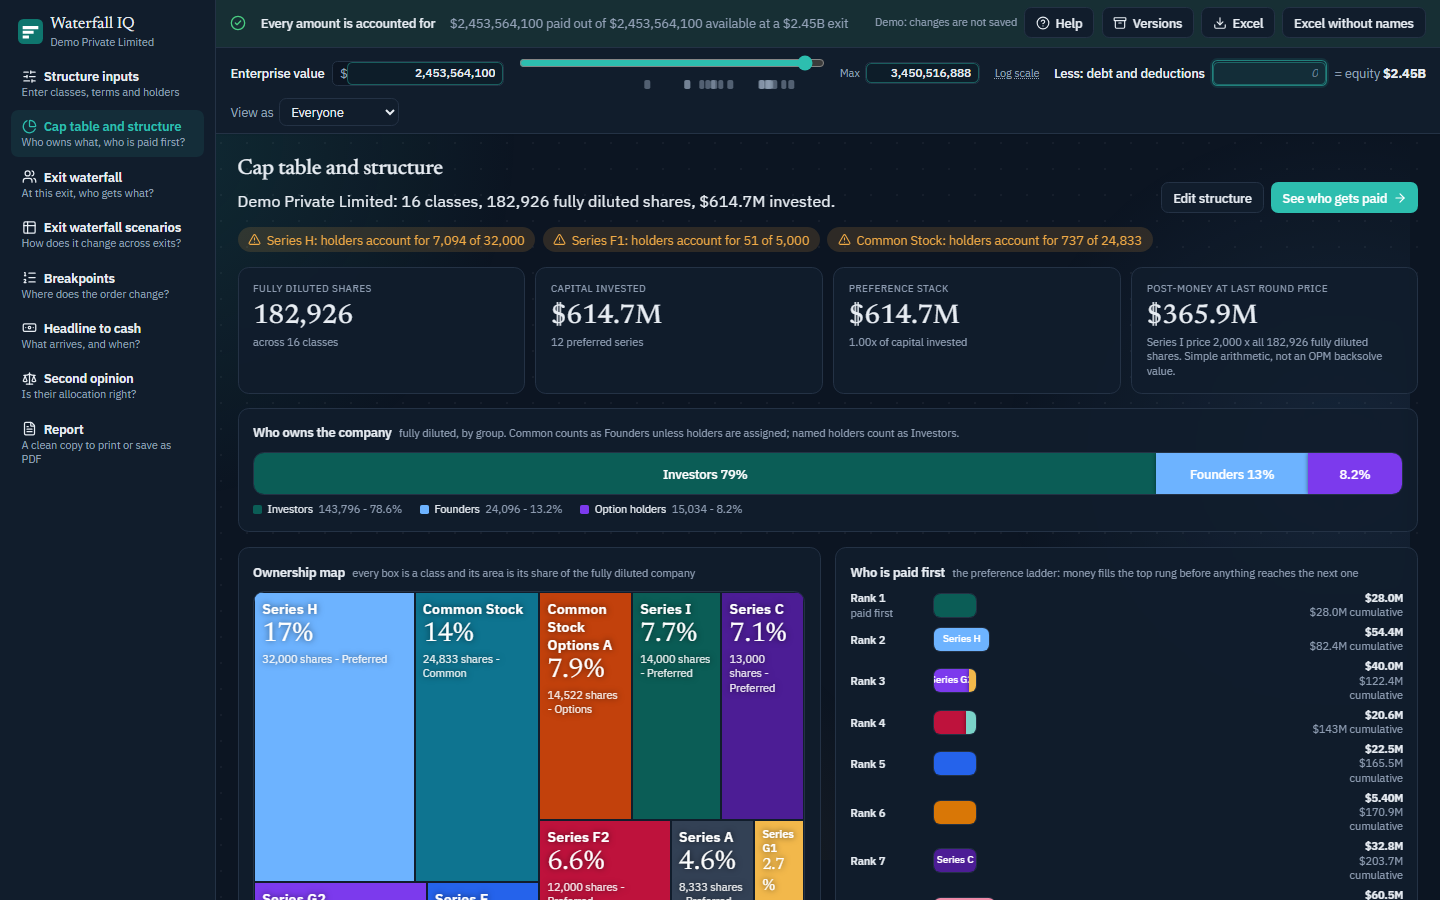
Waterfall IQ · Cap table and structure
Waterfall IQ Cap table and structure screen: Who owns the company, who is paid first, and what each round cost, as pictures.

Who owns the company, who is paid first, and what each round cost, as pictures.

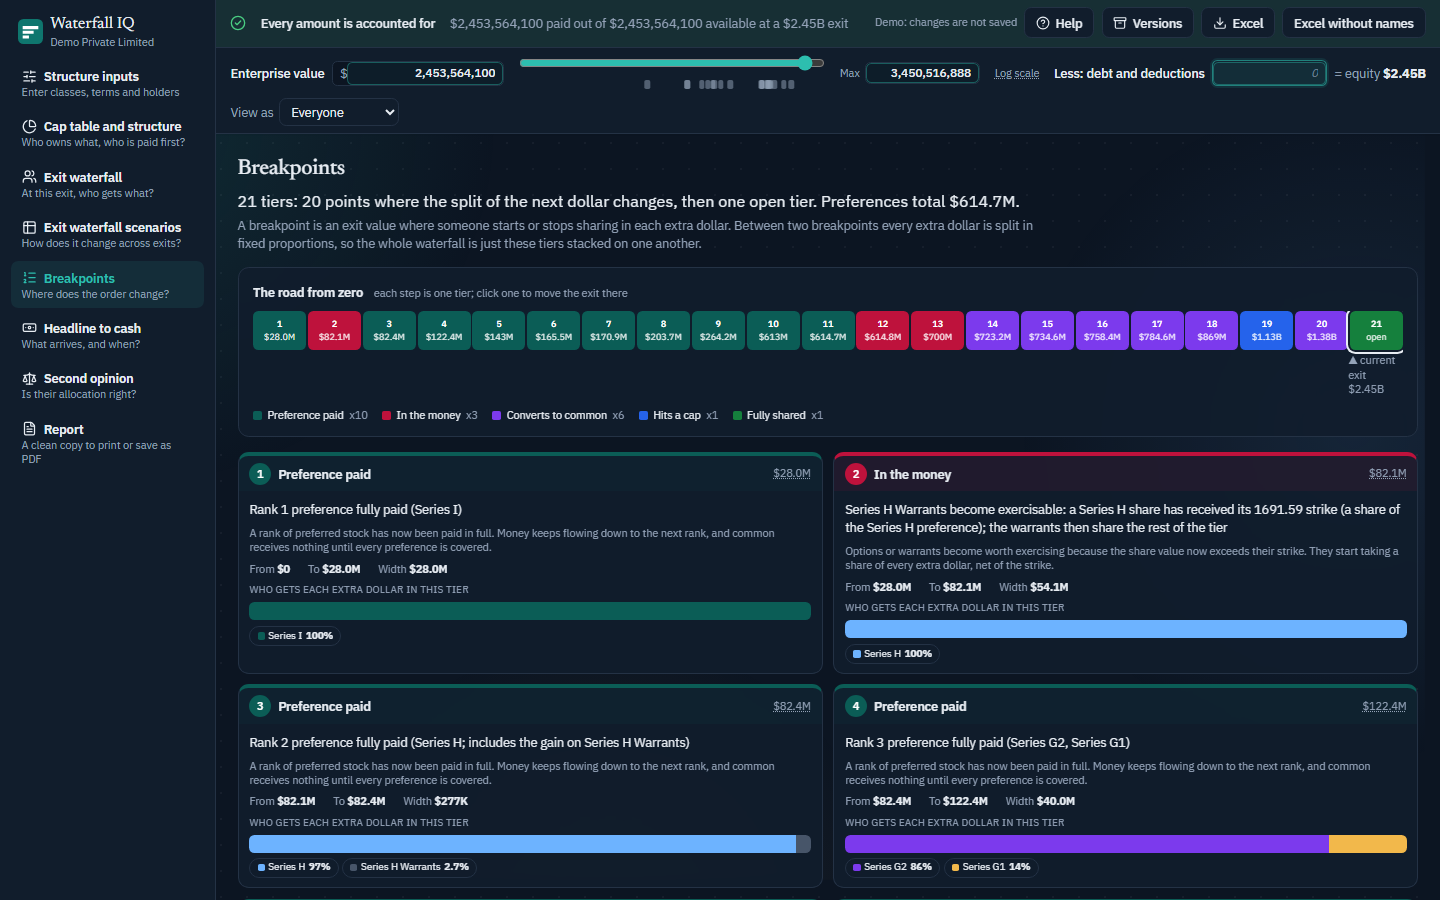
Waterfall IQ · Breakpoints
Waterfall IQ Breakpoints screen: Every price where the split of the next dollar changes, explained tier by tier.

Every price where the split of the next dollar changes, explained tier by tier.

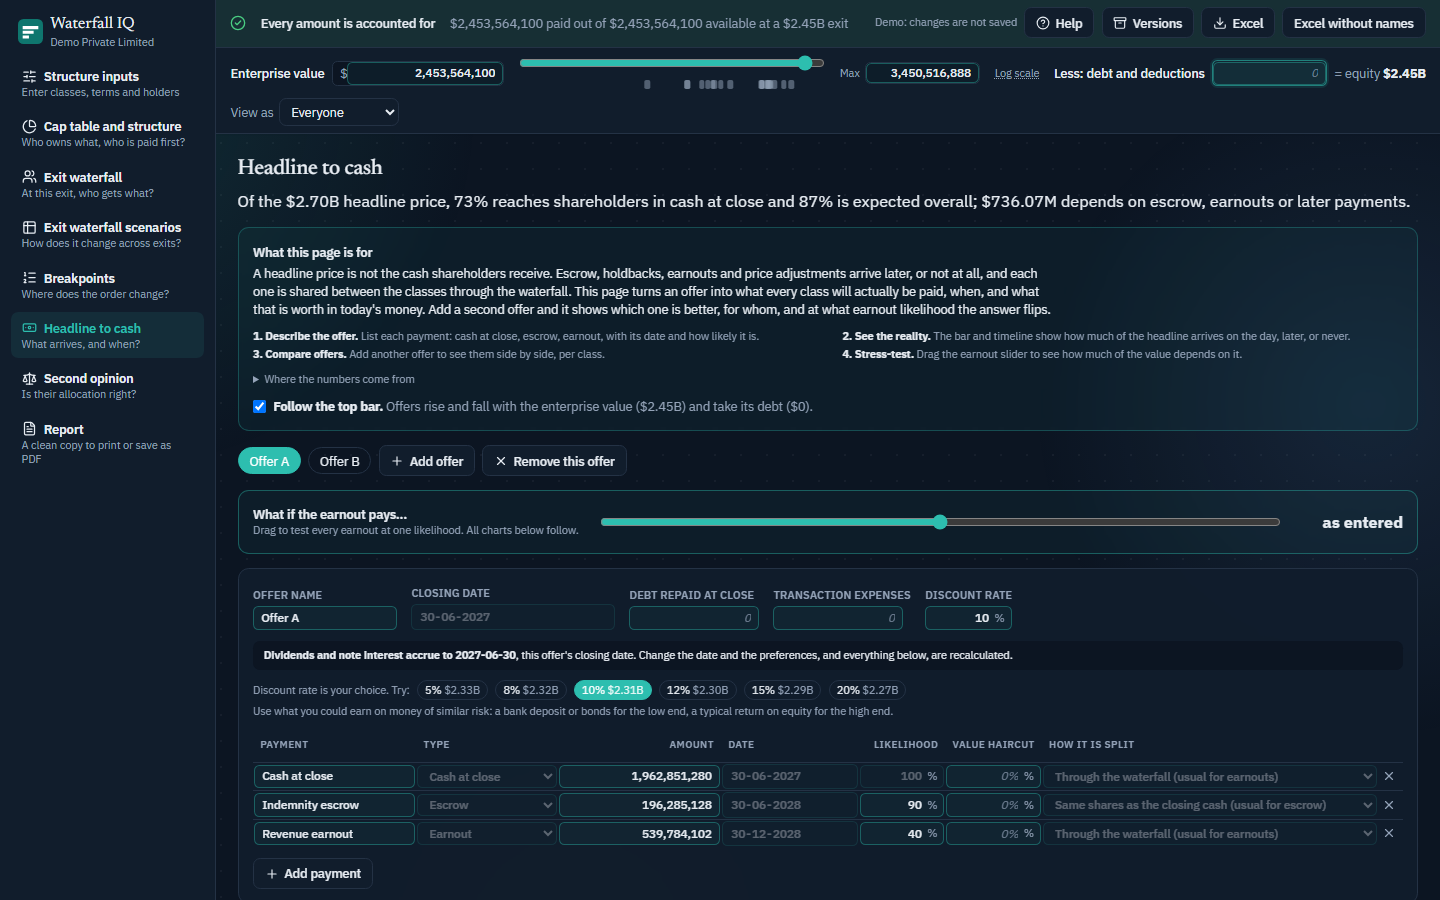
Waterfall IQ · Headline to cash
Waterfall IQ Headline to cash screen: What arrives on the day, what to expect, and what it is worth, for each offer.

What arrives on the day, what to expect, and what it is worth, for each offer.

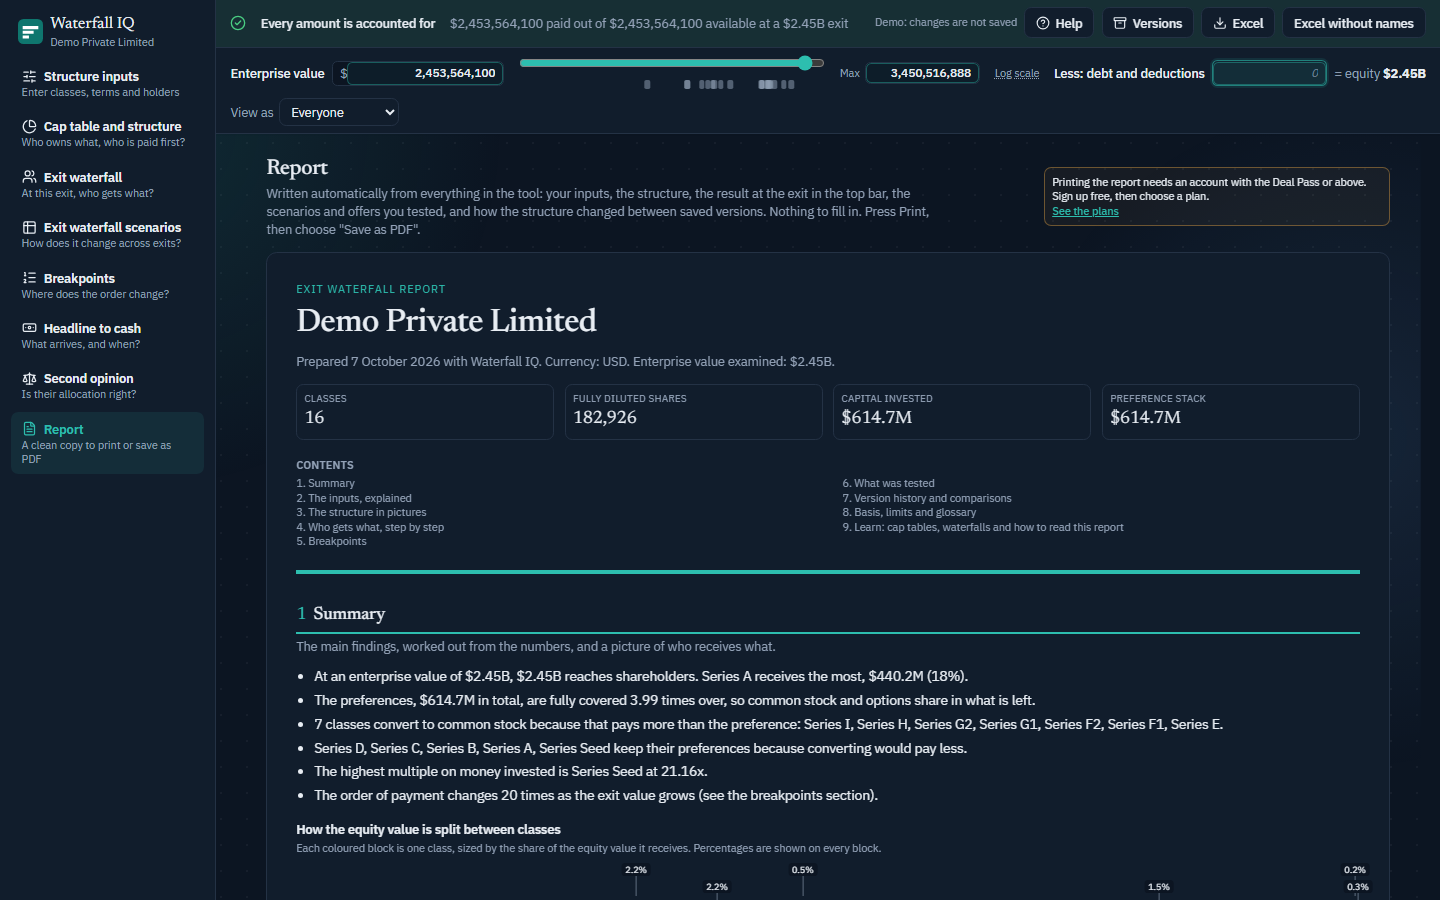
Waterfall IQ · Report
Waterfall IQ Report screen: A detailed report that explains every input and every result, ready to print.

A detailed report that explains every input and every result, ready to print.

Try it on the sample

Simple pricing

Start free. Pay when you need more.

Explore the full tool on a sample company at no cost. Upgrade for your own companies, sharing and exports.

Free

$0

Explore the sample company, the free offer check and the waterfall checker.

Deal Pass

One-off

Everything, for one live exit, for 60 days. Made for founders, boards and advisers who need it intensely for a few weeks.

Professional and Firm

Monthly

Unlimited scenarios, sharing, branded exports and advanced analysis for funds and advisory firms.

See plans and what is included

Questions

Straight answers.

What is an exit waterfall?

The order in which the money from selling a company is paid out: first debt and costs, then preferred shareholders by rank, then everyone who shares in what is left. Waterfall IQ works this out for any cap table and any price.

Do I need legal documents or a cap table system?

No. You type in the classes and their terms, or import a spreadsheet. Nothing is read from your legal documents, and you can use the tool without connecting any other system.

How accurate is it?

All money is calculated in exact decimal arithmetic and settled to the cent, and the classes always add up to the equity value. The engine is checked against thousands of randomly built cap tables on every change. It is only as right as the terms you enter, so check them against the governing documents.

Does it handle SAFEs, notes, options and warrants?

Yes: pre- and post-money SAFEs, convertible notes with interest, options and warrants (including warrants into a preferred series), dividends, participation caps and conversion ratios.

Who can see my data?

Only you. Your inputs are used to produce your results and are not sold or shared. See the trust page for the method and privacy approach.

Is this advice?

No. It shows how the terms you enter would share proceeds. It does not replace legal, tax or financial advice, and the share rights in your documents always prevail.

See who really gets paid.

Open the sample company and move the exit price. It takes a minute.